Tutorial: Reports
Reports are how you can review your budget, and verify how well you kept to it. There are a few built in reports which are included with Buddi; in addition, you can download other plugins, written by third parties, which add additional reports. In this tutorial, we will only cover a few of the built in reports, but all of them will use the same basic methods.
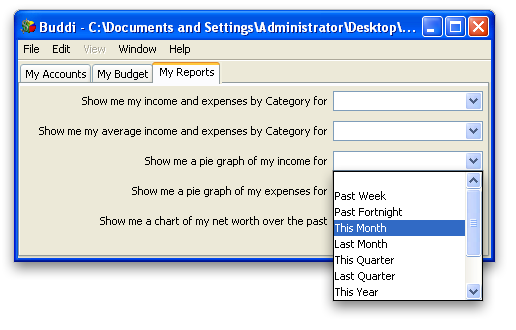
When you first click on the "My Reports" section, you will see a list of possible reports, with a pulldown for each to select the time period which you wish to use. The details of what is shown in each report should be clear from the text. For instance, in the screenshor below, we are about to select the time period "This Month" for the Income Pie Graph report.
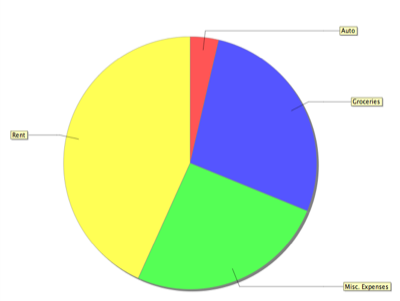
When you select this option, a web page will open in your browser, showing the report, using transactions within the specified range. An example of a Pie Graph report is shown below; for this particular example, we don't have many transactions or budget categories defined, but you can see how the report will look.
Not all reports are graphical. For instance, if you select the report "Show me my income and expenses by Budget Category", you will see a chart like the following:
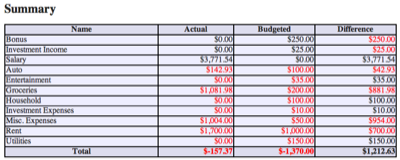
The report continues on, giving specifics about each of the transactions. To save space, I had to only show the summary here.
All Done! Return to Quickstart Introduction